Wednesday, April 8, 2009

Binning Baseball Ages

To motivate the issues on the next EDA topic, I collected the ages of all 651 pitchers who played major league baseball during the 2008 season.

I have a vector age that contains the ages in years for these pitchers.

A histogram is a standard way of graphing this data.  Before I graph, I should select reasonable bins; I could use the default selection of bins chosed by the R hist command, but I typically like more control over my graphical displays.

Here I'm interested in the number of players who are each possible age 20, 21, 22, ... etc.  So choose cutpoints 19.5, 20.5, ..., 46.5 that cover 
the range of the data and so there will be no confusion about data falling on bin boundaries.

cutpoints=seq(19.5,46.5)

Now I can use the hist function using the optional breaks argument.

hist(age,breaks=cutpoints)


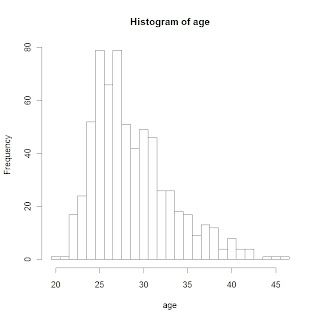
What do I see in this display?
  • The shape of the data looks a bit right-skewed.  I'm a little surprised about the number of pitchers who are 40 or older.
  • The most popular ages are 25 and 27 among MLB pitchers.
  • Looking more carefully, it might seem a little odd that we have 79 pitchers of ages 25 and 27, but only 66 pitchers who are age 26.
What is causing this odd behavior in the frequencies for popular ages?  We don't see this behavior for the bins with small counts.

Actually, this "odd behavior" is just an implication of the basic EDA idea that

LARGE COUNTS HAVE LARGER VARIABILITY THAN SMALL COUNTS

So we typically will see this type of behavior whenever we construct a histogram.

When we plot a histogram, it would seem desirable to remove this "variability problem" so it is easier to make comparisons.  For example, when we compare the counts to expected counts assuming a Gaussian model, it will be harder to look at residuals for bins with large counts and bins with small counts since we will have this unequal variability problem.

This discussion motivates the construction of a rootogram and eventually a suspended rootogram to make comparisons with a symmetric curve.

By the way, can we fit a Gaussian curve to our histogram?  On R, we

  • first plot the histogram using the freq=FALSE option -- the vertical scale will be DENSITY rather than COUNTS
  • use the curve command to add a normal curve where the mean and standard deviation are found by the mean and sd of the ages
Here are the commands and the resulting graph.

hist(age,breaks=cutpoints,freq=FALSE)
curve(dnorm(x,mean(age),sd(age)),add=TRUE,col="red",lwd=3)


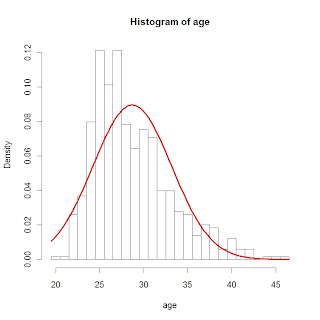
It should be clear that a Gaussian curve is not a good model for baseball ages.

Wednesday, March 25, 2009

Looking at Hits on my Web Page

The next topic is two-way tables. To illustrate the application of median polish, I took some convenient data, that is, a data that was readily available to me.

A couple of years ago, I wrote a book on Bayesian computing using R. I have a website that gives resource material for the book and I use Google Analytics to monitor hits on this particular website. Each day I observe the number and location of hits; it is interesting data partly since it seems that statisticians from many countries are interested in my book.

Anyway, here is the data -- a number in the table represents the number of hits for a particular day of the week for a particular week.

Week 1 Week 2 Week 3 Week 4
Sunday 22 12 17 15
Monday 23 15 27 17
Tuesday 17 26 21 14
Wednesday 26 13 18 18
Thursday 24 27 28 13
Friday 28 17 17 19
Saturday 14 11 13 13

I am interested in how the website hits vary across days of the week and also how the website hits vary across weeks. I can explore these patterns by means of an additive fit that I do by the median polish algorithm.

Since the data is stored as a matrix, a median polish is done by the medpolish function:

fit=medpolish(web.hits)

The variable "fit" stores the output of medpolish. Let's look at each component of medpolish.

> fit$overall
[1] 18

This tells that the average number of hits (per day) on my website was 18.

> fit$row
Sunday Monday Tuesday Wednesday Thursday Friday
-2.00 0.50 -0.50 0.00 5.50 1.75
Saturday
-5.25

These are the row effects. For Sunday, the row effect is -2 -- this means that on this day, the number of hits tends to be 2 smaller than average. Comparing Sunday and Monday, there tends to be 0.50 - (-2.00) = 2.5 more hits on Monday.

> fit$col
Week 1 Week 2 Week 3 Week 4
4.50 -2.75 1.00 -1.00

These are the column effects. It looks like my website hits across weeks where HIGH, LOW, high, low. On average, there were 4.50 - (2.75) = 7.25 more hits on Week 1 than Week 2.

The remaining component in the additive fit are the residuals. These tell us how the hit values deviate from the fitted values (from the additive model).

> fit$residuals
Week 1 Week 2 Week 3 Week 4
Sunday 1.50 -1.25 0.00 0.00
Monday 0.00 -0.75 7.50 -0.50
Tuesday -5.00 11.25 2.50 -2.50
Wednesday 3.50 -2.25 -1.00 1.00
Thursday -4.00 6.25 3.50 -9.50
Friday 3.75 0.00 -3.75 0.25
Saturday -3.25 1.00 -0.75 1.25

If the residual values are generally small (small compared to the row and column effects), then the additive model is a good description of the patterns in the data. Actually, the residuals look large to me, so I'm not sure I'd get that excited about this additive fit. Specifically, the residual for Tuesday, Week 2 is 11.25 -- for some reason, this particular day had many hits -- many more than one would expect based on its day of the week and week number.

Tuesday, March 17, 2009

Smoothing on R


One of you asked how to produce a "3RSSH, twice" smooth on R.  It seems that my R notes on the web could be clarified.  Here I illustrate a simple function to do the smooth that we want.

Here is a new function that you can use called smooth.3RSSH.twice.

smooth.3RSSH.twice=function(data)
{
SMOOTH=han(smooth(attend,kind="3RSS")) # 3RSSH smooth
ROUGH=data-SMOOTH                      # computes the rough
SMOOTH+han(smooth(ROUGH,kind="3RSS"))  # twicing operation
}

This program does three things:

1.  First, one computes a 3RSSH smooth using the smooth command in R and the han function from the LearnEDA package.

2.  Then one computes the rough (the residuals) from this smooth.

3.  Then one smooths the rough (using the same 3RSSH smooth) and adds this "smoothed rough" to the first smooth to get a "twiced smooth".

Here is an illustration of how it works for the Braves attendance data from the notes.
(I am assuming the above function has been read into R.)

library(LearnEDA)
data(brave.at)
attach(brave.at)
plot(game,attend)
the.smooth=smooth.3RSSH.twice(attend)
lines(game,the.smooth,lwd=3,col="green")


Monday, March 16, 2009

Smoothing Free Throw Percentages

I hope you had a nice spring break. My son's tennis team is flying to Florida this week -- I wish I could join him.

Since March Madness is starting, I thought it would be appropriate to talk about basketball data. There was an interesting article about free-throw shooting that recently appeared in the New York Times. See the article here.

The main message was that free-throw shooting in professional basketball has hovered about 75% for many years. Unlike other athletic performances such as running and swimming, basketball players don't seem to be getting better in shooting free throws.

Is that really true? Has free-throw shooting accuracy remained constant for all of the years of professional basketball?

To answer this question, I collected some data. For each of the seasons 1949-50 through the current season 2008-09, I collected the overall free-throw shooting percentage in the NBA.

Here are the shooting percentages graphed as a function of year.


Actually, although the overall free-throw shooting percentage is approximately 75%, there seems to some interesting patterns in the graph.

To better see the patterns, I use the command

han(smooth(FTP,kind="3RSS"))

to superimpose a 3RSSH smooth on the graph and I get the following:


What patterns do we see?

1. In the early days between 1950-1970, the shooting percentages were relatively low with a valley around 72% in the late 1960's.

2. The shooting percentages increased through the 1970's, had a small valley and hit a peak of about 76% in 1990.

3. Then the percentages decreased again and had a local minimum of 74% around 1995.

4. In recent years, the percentages are increasing. It is interesting that the current free-throw shooting percentage 77.2 is the highest in NBA history.

So in reality, the shooting percentage has not stayed flat across years. But it is surprising that NBA players haven't learned to shoot free throws better in the last 60 years.

Monday, March 2, 2009

Fitting a Line by Eye

You did fine on the latest Fathom "fitting line" homework. But I sensed a little confusion and I should make a few comments about fitting a line by eye.

Let's return to that homework problem where you are plotting the OBP of the baseball players for two consecutive years.

Here is a plot that many of you produced.


Is this a good graph? Actually, NO since there is too much white space around the points.

You can improve this in Fathom by using the hand tool to fill up the space. Here is a better plot.


Second, it is not easy to fit a movable line. To make this process easier, plot the movable line and then add a residual graph.


A good line will remove any tilt pattern in the residual graph. I still have a downward tilt in this graph - this suggests I have to try a little harder.


This looks better -- I don't see much of an increasing or decreasing pattern in the residuals.

Does my best fit correspond to a least-squares or resistant fit? (By the way, the resistant line is called a median-median line in Fathom.) I show all three lines below. Least-squares is blue, median-median is purple, and my line is brown.


It looks like my line is closer to the resistant fit.

Generally, when one has outliers, I would anticipate that my line would be closer to the resistant median-median line.

Friday, February 27, 2009

Graphical User Interface for R

Since some of you seem to be struggling with R's interface, where you type commands and you have to know the R functions.

There is an attractive package called R Commander which provides a menu interface for R. You work in a special window and most of the useful R functions are available as options in menus.

On the left, you see a snapshot of R Commander (on a Macintosh).

How do you get R Commander? It is easy -- you just install the package Rcmdr from CRAN. This package uses a number of other R packages. If you don't have these other packages installed yet, then R will automatically install these (it takes a little while -- be patient).

One of my former students who teaches at Youngstown State uses R Commander in his statistics classes. He says "Rcmdr is really cool, and the students eat it up."

Anyway, you might want to try this. You can run the functions in LearnEDA by first loading it and typing commands (like lval) in the top window.

Let me know if you find this helpful, since I haven't done much with it.

Thursday, February 26, 2009

Plotting and Straightening on R

To encourage you to use R for next week's assignment, I put together a new movie showing R in action.

As you probably know, one of the fastest growing companies in the U.S. is Google.  I found an interesting graph showing Google's growth (as measured by the number of employees):


Obviously there has been a substantial increase in Google employees over this two year period.  But we wish to say more.  We'd like to describe the size of this growth.  Also, we'd like to look at the residuals that will detect possible interesting patterns beyond the obvious growth.

Here's the plan.

1.  We start with plotting the data, fitting a resistant line, and looking at the residuals.

2.  By looking at the half-slope ratio and the residuals, we decide if the graph is straight.

3.  If we see curvature in the graph, then we try to reexpress one or more of the variables (by a power transformation) to straighten the graph.  We use half-slope ratios and residual plots to see if we are successful in straightening the graph.

4.  Once the graph is straight, then we summarize the fit (interpret the slope of the resistant line) and examine the residuals.

The key function in the LearnEDA package is rline.

I illustrate using rline in my new movie 


The dataset can be found at http://bayes.bgsu.edu/eda/data/google.txt 
and my script of R commands for this analysis can be found at

By the way, I'm using a new version of the LearnEDA package that you can download at


Hope this is helpful in your work next week.