Tuesday, August 26, 2008

Example of data analysis on R


Here is a typical data analysis on R. I'm a baseball fan and I'm interested in the wins and losses for the current Major League teams and how these wins and losses are related to the runs scored and runs allowed.

In Excel, I create a dataset that contains the wins, losses, runs scored, and runs allowed for all 30 teams. Here is the first 4 rows of the dataset.

Team League W L RS RA
Tampa Bay American 79 50 597 515
Boston American 75 55 670 559
NY Yankees American 70 60 632 585
Toronto American 67 63 574 510

I save this dataset as "baseball2008.txt" -- text, tab-delimited format. I save this file in a folder called "eda" and I make this the current R working directory so R will find this file.

Here is my analysis:

# read the datafile into R

data=read.table("baseball2008.txt",header=T,sep="\t")

# attach the data to make the variable names available in R

attach(data)

# compute the winning proportion for all teams

win.prop=W/(W+L)

# what was the largest winning proportion?

max(win.prop)

[1] 0.6183206

# which team had the largest winning proportion?

Team[win.prop==max(win.prop)]

[1] Chicago Cubs

# for each team, compute the number of runs scored per game

runs.game=RS/(W+L)

# construct a stemplot of the runs scored per game
# (I'm assuming you have the aplpack package installed)

library(aplpack)
stem.leaf(runs.game)

1 | 2: represents 1.2
leaf unit: 0.1
n: 30
1 s | 7
4 3. | 889
7 4* | 011
8 t | 2
12 f | 4555
(6) s | 666667
12 4. | 88899
7 5* | 00011
t |
2 f | 45

# (sorry the display got messed up when I put it on this blog)
# you get a similar display by using a histogram

hist(runs.game)


# there are two teams who stand out with respect to runs scored

Team[runs.game>5.3]

[1] Texas Chicago Cubs

# what is the average number of runs per game scored by a team?

mean(runs.game)

[1] 4.621464

# do American League teams score more than National League teams?

mean(runs.game[League=="American"])

[1] 4.756021

mean(runs.game[League=="National"])

[1] 4.503728

# there is an interesting relationship between a team's winning
# proportion and the number of runs scored and runs allowed
#
# the relationship is log(W/L) = k log(RS/RA)
# where k is typically near 2

# we'll compute log(W/L), log(RS/RA)
# and fit a least-squares line -- we'll see if the slope is close to 2

log.WL=log(W/L)
log.RR=log(RS/RA)

lm(log.WL ~ log.RR)

Coefficients:
(Intercept) log.RR
-0.0003097 1.8377065

# here we see the slope is 1.84 which relatively close to 2

accessing Fathom

As a student that is a couple of hours removed from BGSU is there anyway I can install Fathom without coming to the campus?

Monday, August 25, 2008

Learning R

R is a great program but it has a relatively steep learning curve. To help you get started, I have three help sessions on R planned this week -- you need only attend one of the sessions.

I have four documents R_INTRO_PART_I, R_INTRO_PART_II, R_INTRO_PART_III, and R_INTRO_PART_IV in the Course Documents section that describe different aspects of R.

1. Manipulating vectors. A basic object in R is a vector. R_INTRO_PART_I discusses how to create and work on vectors.

2. Input and output. One typically wants to read datafiles into R -- read.table is useful for doing this. Data is typically stored in a R object called a data frame. Also you'll want to save R output including graphs and paste this material into a Word document.

3. Matrices. You should be comfortable working and manipulating matrices in R.

4. Plotting. You should be familiar with basic plotting commands and understand how one can add things (like labels and titles) to to graphs.

I hope you have R installed on your laptop. You may find it helpful to bring your laptop to the help session.

Friday, August 22, 2008

Installing R Packages

Now that you have successfully installed R, you have access to many functions in the R "base" package. But we'll want to add packages that will give us additional functions helpful for the class. I'll illustrate adding the package "aplpack" that we'll need to get the "stem.leaf" function. Also, I'll show you how to add the "LearnEDA" package that I wrote for the class.

Installing the package aplpack from CRAN.

1. In R, choose the menu item Packages -> Install Packages.

2. You'll be asked to choose a CRAN mirror site -- choose one in the United States.

3. Then you'll see a list of all available Packages -- choose aplpack.

4. At this point, the package will be downloaded and installed -- if you see the message

package 'aplpack' successfully unpacked and MD5 sums checked

you're in good shape.

5. The package aplpack is installed but not yet loaded into R. To load the package, you type

library(aplpack)

6. To check to see if you have the aplpack commands, try constructing a stemplot on a random sample of values from a standard normal distribution:

stem.leaf(rnorm(50))

If you get some display, you're set.

Installing the class package LearnEDA.

This is a package that I wrote that has some special functions and all the datasets we'll use. This is not available on CRAN yet, since it is still in development. But it is available from my website.

1. Go to the class web folder http://bayes.bgsu.edu/EDA/ and find the zip file

LearnEDA_1.0.zip

Download this file to the Windows desktop (or some other convenient place).

2. To install this package, select Packages -> Install Package(s) from local zip files

3. Select the LearnEDA_1.0.zip file. In a short time, R will install this package.

4. To see if you have successfully loaded this package, load in the package and check to see if you can read in one of the class datasets.

library(LearnEDA)
data(football)
football

If you see a lot of football scores, then you have succeeded in loading this package.

Installing R

Welcome to the EDA blog. I thought this would be a useful way of communicating and giving you advice that will help you succeed in this class.

My advice will apply to a Windows user which I think will apply to most to you. R also works fine on a Macintosh, but the precise instructions are a little different.

1. Go to The Comprehensive R Achieve Network at http://cran.r-project.org/

2. First choose a Mirror (click on Mirrors on the left) site somewhere in the United States -- this will shorten your download time.

3. Click on Windows in the Download and Install R section. Click on base and then click on the R-2.7.1-win32.exe link.

4. When this is downloaded on your machine, click on the R-2.7.1-win32.exe file. At this point, you'll just follow the instructions and the most recent version of R (2.7.1) will be installed.

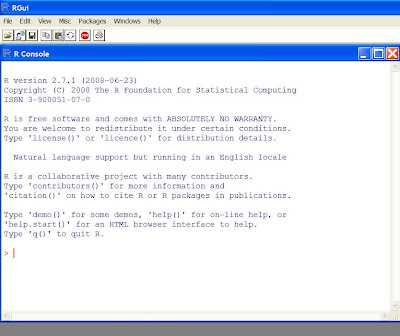
5. To launch R, just double-click on the R icon on your desktop and you'll shortly see the following screen.