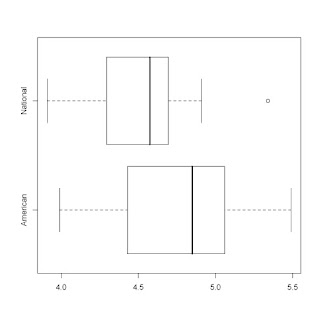
I'm interested in comparing the team statistics for baseball teams this year -- I've heard
that American League teams score more runs. Is that true?
Using data from baseball-reference.com, I created a dataset 2008teamstats.txt that contains current statistics for all 30 baseball teams.
Here's my R script. I'll paste in a horizontal-style boxplot display at the end.
> b.data=read.table("http://bayes.bgsu.edu/eda/data/2008teamstats.txt",header=T)
> b.data[1:5,1:5]
Tm League R.G R G
1 TEX American 5.49 835 152
2 BOS American 5.29 799 151
3 MIN American 5.16 779 151
4 DET American 5.06 759 150
5 BAL American 5.03 750 149
> # I am interested in comparing the runs scored per game
> # (variable R.G) for the American and National league teams
>
> attach(b.data)
>
> # Here are the boxplots:
>
> boxplot(R.G~League)
>
> # boxplot has many options -- if you prefer horizontal style ...
>
> boxplot(R.G~League, horizontal=TRUE)
>
> # To get summary stats for each group, just assign boxplot()
> # to a variable, and then display the variable.
>
> b=boxplot(R.G~League, horizontal=TRUE)
>
> b
$stats
[,1] [,2]
[1,] 3.99 3.910
[2,] 4.43 4.295
[3,] 4.85 4.575
[4,] 5.06 4.695
[5,] 5.49 4.910
$n
[1] 14 16
$conf
[,1] [,2]
[1,] 4.583968 4.417
[2,] 5.116032 4.733
$out
[1] 5.34
$group
[1] 2
$names
[1] "American" "National"


No comments:
Post a Comment